
Welcome to the WINTER 2018 Finance Shop Wealth Management (FSWM) Quarterly Review.
The Finance Shop Quarterly Review provides clients in our Advisory Portfolio Management (APM) service a review of the financial world over the last three months, and how this may have affected their pension or investment. If you would like to read more about this service, please Click Here.
A key part of the reporting is the colour coding. Each FSWM portfolio is colour coded to enable you to spot which category applies to you. The relevant information is then presented in a clear and easy to understand way. However, if you require any further clarification, please do not hesitate to get in touch.
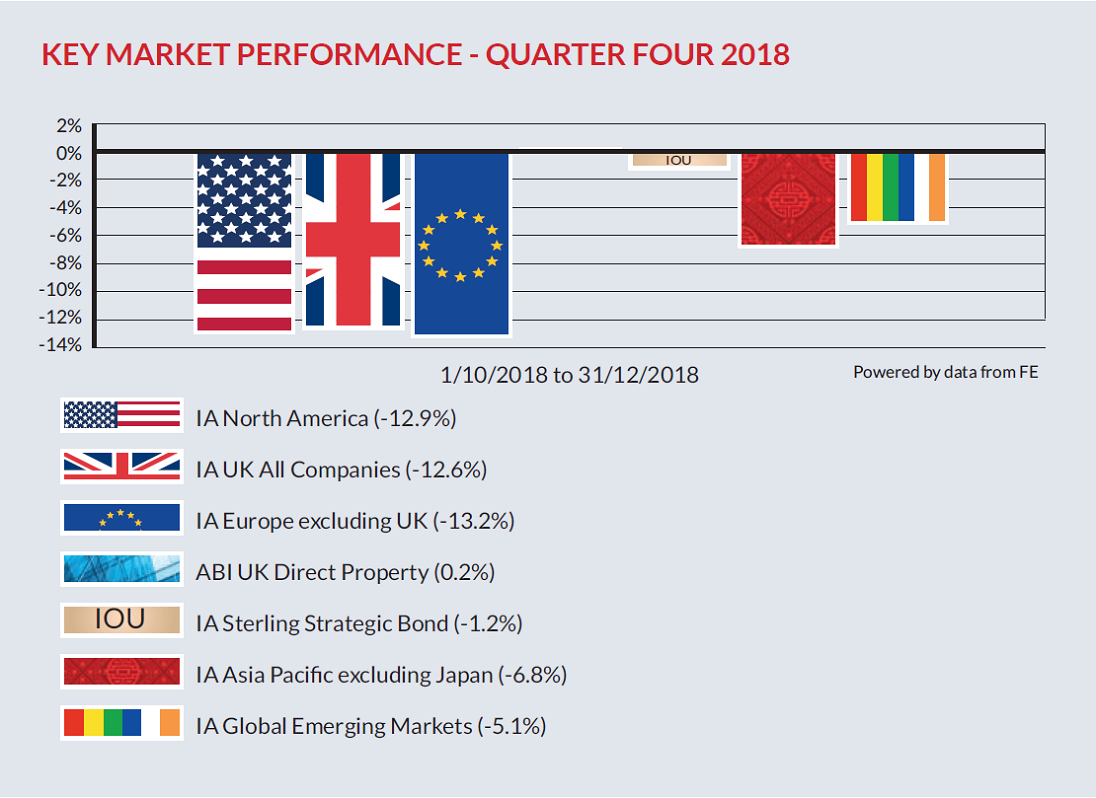
MARKET OVERVIEW – QUARTER FOUR 2018
Quarter four was a torrid period for global markets with nearly all asset classes falling. This led to many indices posting falls of more than 10% over 2018 (indeed the FTSE 100 fell 12.5% over the calendar year), with several in bear market territory (a fall of more than 20%). A number of factors contributed to unsettle investors including concerns over the strength of global growth, the impact of rising interest rates in the US and worries over the growing trade dispute between China and the US. Closer to home political deadlock over Brexit also fuelled fears of a disorderly exit, causing a wider slowdown in the economy.
The big change over the quarter was the weakness in US markets which, up until September, had largely remained immune from falls in other global indices. The shift in sentiment was driven by technology stocks which, despite stellar earnings numbers, were more cautious on the outlook for 2019. This in turn led to a negative feedback loop as trade war rhetoric between the US and China ramped up and, despite public criticism from President Trump, Jerome Powell (Chair of the Federal Reserve) continued to raise US interest rates fuelling concerns over slowing growth in 2019.
On the face of it, it appears a negative backdrop for investors as we enter 2019, and whilst there are undoubtedly more headwinds than for sometime, it may well prove that markets have become overly pessimistic and growth surprises on the upside.
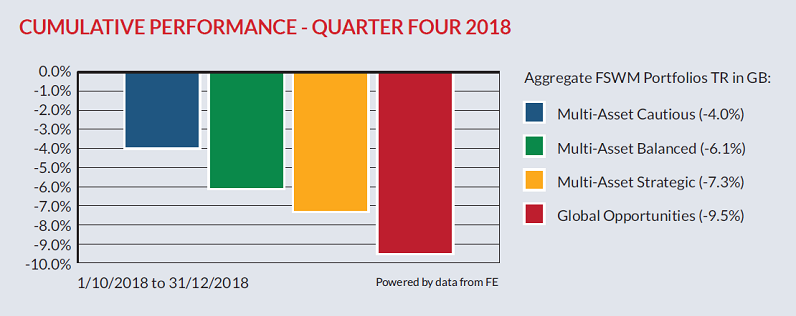
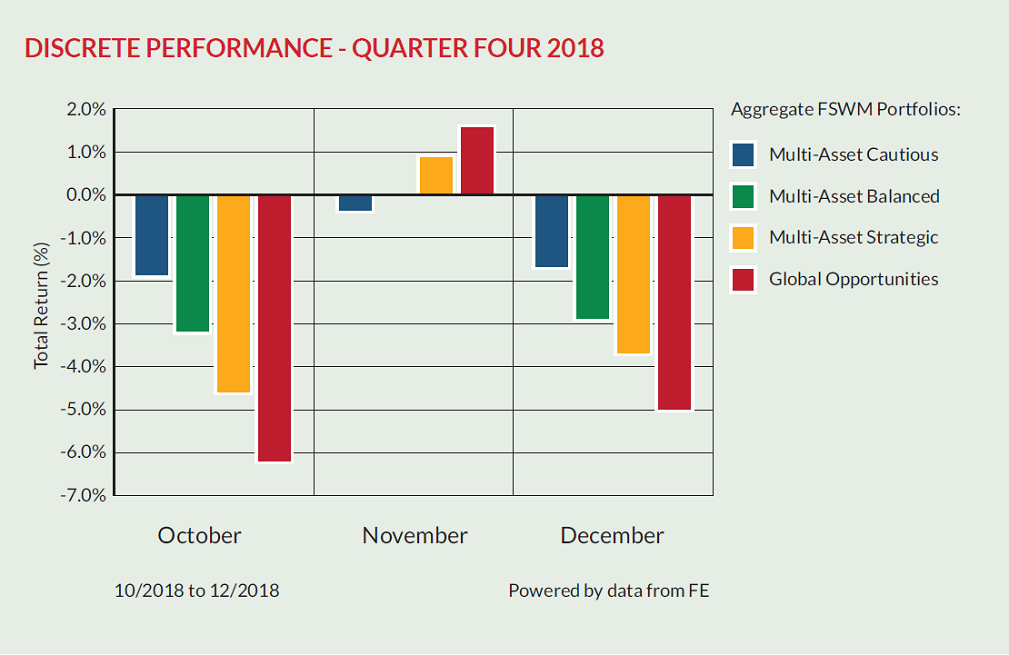
FSWM PORTFOLIOS – QUARTER FOUR 2018 PERFORMANCE
The graphs below show how the FSWM portfolios within the four Finance Shop risk categories have behaved over the last three months. The first graph shows the total return for the quarter whereas the second graph illustrates the “month by month” performance. The performance figures are aggregated so, for example, the green bar is made up of all the FSWM Multi-Asset Balanced portfolios across all product types. If you require specific performance figures for your plan, please contact your adviser.
PERFORMANCE REVIEW
The extremely challenging backdrop saw all the portfolios lose ground over the fourth quarter, and unsurprisingly the more adventurous portfolios fell furthest. Falls in the fourth quarter also led to the portfolios posting their first yearly losses for a number of years. That said, it was pleasing to see that the portfolios on the whole outperformed their benchmarks and the wider markets by some considerable distance.
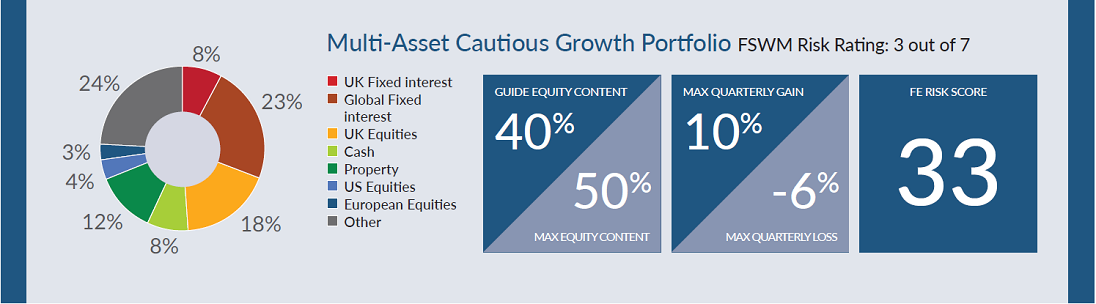
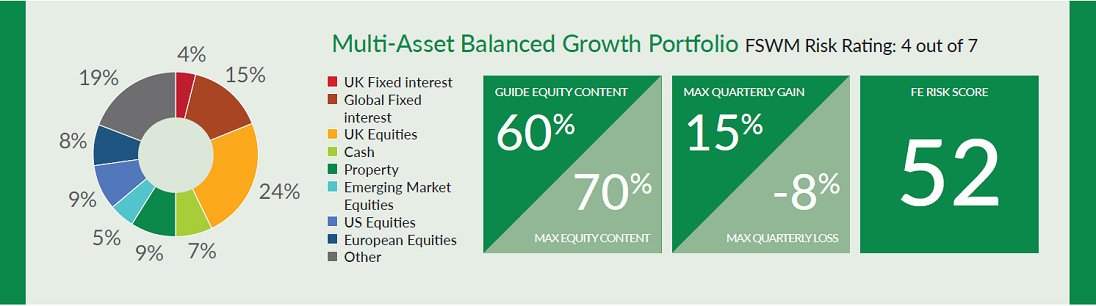
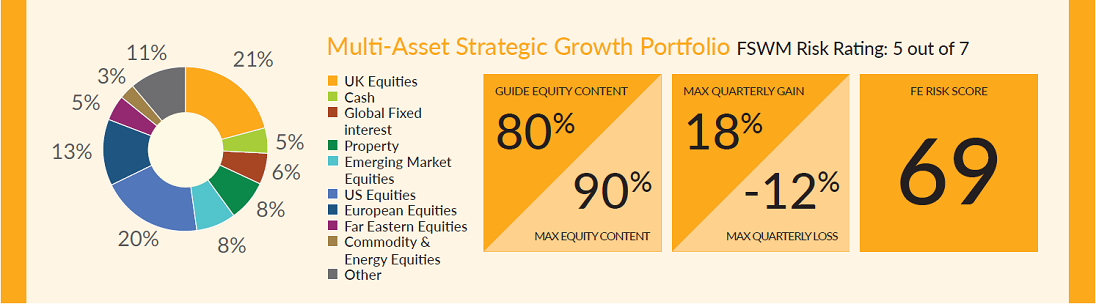
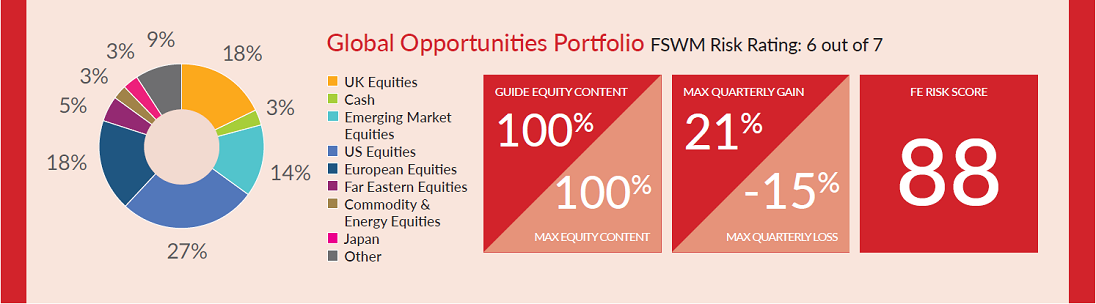
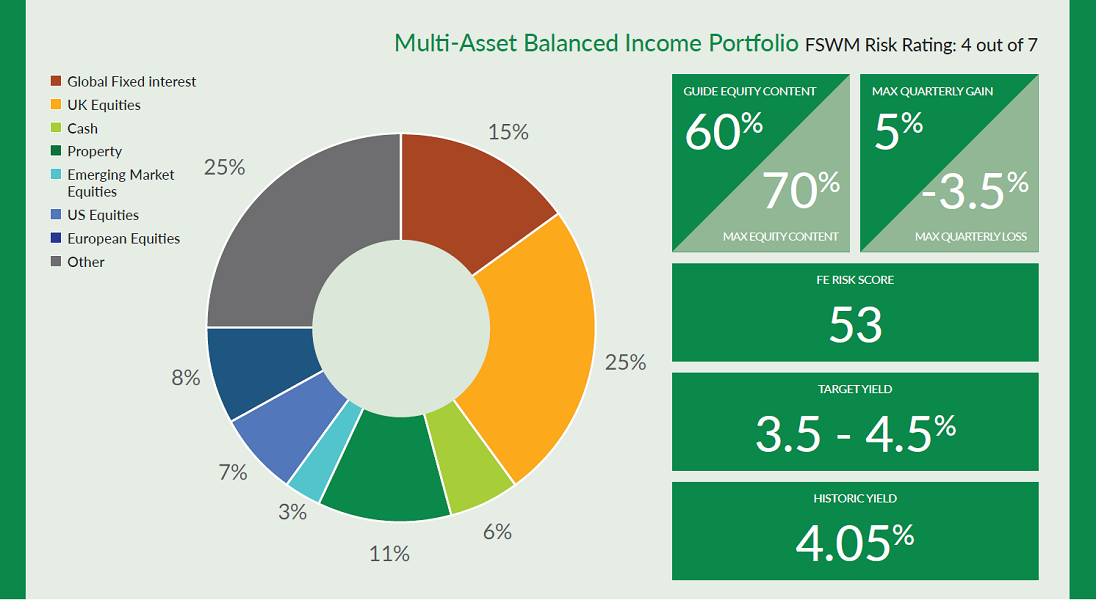
FSWM PORTFOLIOS – ASSET ALLOCATION
There are six portfolios in the FSWM range, four growth and two income which are detailed below. Your FSWM pension or investment will be invested in one of these categories. The tables show the aggregate composition of the portfolios with some figures to show the potential risk and return of each category.
GROWTH PORTFOLIOS
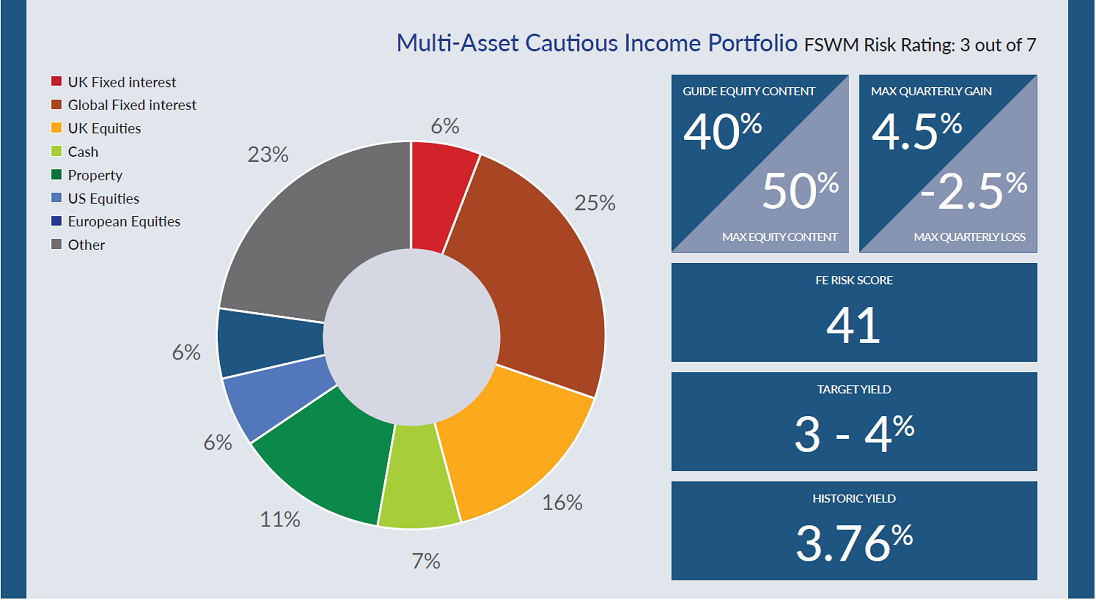
INCOME PORTFOLIOS
There are two income portfolios which aim to produce an income within a target range as highlighted in the table below. The two portfolios cover the Cautious and Balanced Finance Shop risk categories.
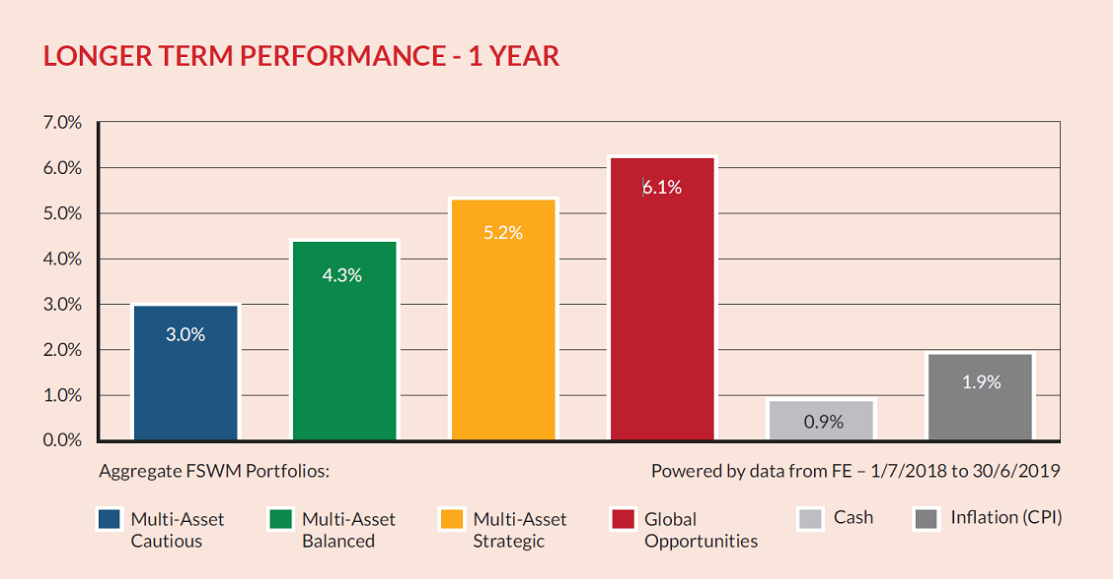
FSWM PORTFOLIOS – LONGER TERM PERFORMANCE
The first graph below shows how the FSWM portfolios have performed over 12 months. For comparison, the returns of cash (MoneyFacts 90 days notice 10K) and inflation (UK Consumer Price Index) are also shown. As with the graphs on page 6, the figures for each category are aggregated.
The second graph illustrates how the portfolios have performed since launch (1st November 2008).
FSWM FUND REVIEW POLICY
A key part of the FSWM service is to monitor the underlying performance of each fund within the portfolios for both risk and return. We have selected quality funds with strong track records and therefore do not envisage a high turnover of holdings. However, there will be occasions when the performance of an individual fund will lead to its expulsion from the portfolio(s). There are a number of factors that determine this decision, for example consistent under-performance, change of management team etc. It is also important, however, to have patience with a fund that is just suffering short-term under-performance.
We operate a “traffic light” system and will move a fund from a “green” to “amber” rating if the fund requires closer scrutiny at the next review. If a fund shows sufficient improvement, it will move back to “green”. If the fund consistently under-performs without good reason its status will change to “red” and the fund will be removed from the portfolio(s). A replacement fund will be selected and all clients holding the fund within their portfolio will be notified. Upon receipt of their authority, the client’s funds will be switched accordingly.
RESULTS OF FUND & ASSET ALLOCATION REVIEW
The Investment Committee meets on a quarterly basis and one of its primary functions is to review our existing fund range.
Within this meeting we scrutinise any funds which we feel are performing significantly differently to their peer group or benchmark, with a number then run against our internal performance and risk measurements.
There were several changes to the funds under review, with Artemis Global Income, Fidelity Strategic Bond, Miton UK Value Opportunities and Tideway Highbred Capital being added and Blackrock Continental European Income, City Financial Absolute and Fidelity Enhanced Income being removed, leaving the following funds under review:
• Ardevora UK Equity
• Artemis Global Income
• Aviva Multi-Strategy Growth
• Fidelity Strategic Bond
• Garraway Financial Trends
• Goldman Sachs Emerging Markets
• Invesco Perpetual Global Income
• Janus Henderson UK Absolute
• Janus Henderson Cautious Managed
• JP Morgan Multi-Asset Income
• Miton UK Value Opportunities
• Tideway Highbred Capital
ASSET ALLOCATION TABLE PAGES FOUR AND FIVE – IMPORTANT INFORMATION
The maximum quarterly gain and loss figures in the asset allocation tables on pages 4 & 5 are taken from Financial Express based on the last 38 quarters of the longest running FSWM portfolios (up to August 2018). For the table on page 5, the figures are based on 20 quarters.
FE Risk Score: Financial Express have introduced FE Risk Scores to provide a single, easy to understand measure of risk across a range of investments. In the UK, Risk Scores measure the riskiness of any given investment in relation to the FTSE 100. Weekly volatility is measured over up to 3 years, with recent behaviour counting more heavily than earlier behaviour. The Risk Score is calculated weekly, and can be tracked over time. Cash type investments will have scores near zero, investment funds will tend to have scores in the 0 - 150 range.
The FTSE 100 is always 100. There is no upper limit to the scores.
The asset allocation figures on pages 4 and 5 are aggregated based on the current holdings within the FSWM portfolios for a new investor as at 1st August 2018 (growth portfolios) and 10th August 2018 (income portfolios). They will vary on a daily basis subject to market fluctuations. Rebalancing will be recommended if equity content exceeds the benchmark maximums. There is no guarantee that any of the model portfolios above will achieve their stated objectives. Each model portfolio may also experience more or less volatility than expected. The value of investments will fall as well as rise and are not guaranteed. Past performance is no guide to future performance. The Finance Shop Risk Categories are graded from 1 to 7. The above portfolios cover categories 3 to 6. For further information on all categories, please speak to your Finance Shop Independent Financial Adviser.