
Welcome to the ADVISORY PORTFOLIO MANAGEMENT (apm) SUMMER 2023 Quarterly Review.
The Advisory Portfolio Management (APM) Quarterly Review provides clients within the service a review of the financial world over the last three months, and how this may have affected their pension or investment. If you would like to read more about this service, please Click Here.
A key part of the reporting is the colour coding. Each APM portfolio is colour coded to enable you to spot which category applies to you. The relevant information is then presented in a clear and easy to understand way. However, if you require any further clarification, please do not hesitate to get in touch.
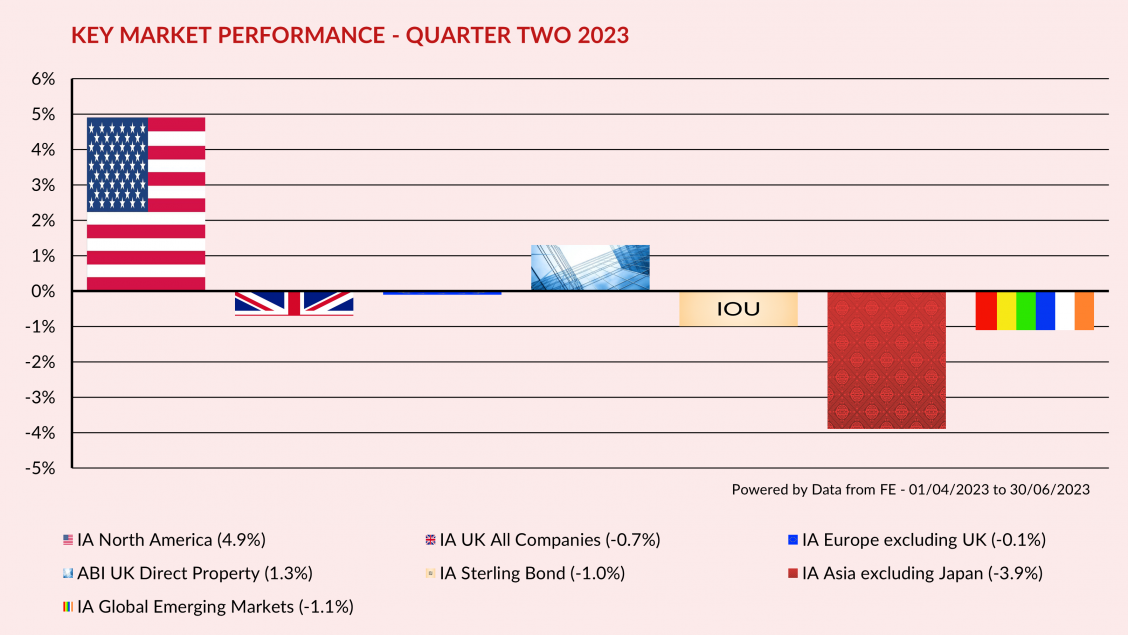
MARKET OVERVIEW - QUARTER TWO 2023
The second quarter proved to be much less eventful than the first, as the measures taken by central banks appeared to have prevented a wider fallout from the mini banking crisis. In addition, economic data has largely surprised to the upside, in much of the developed world and signs that headline inflation numbers are falling has also helped sentiment. This has assisted markets in ignoring the fact that core inflation, which excludes less volatile components such as energy and food prices, has remained sticky, leading central banks to signal further rises in interest rates ahead. In the US, markets have been driven higher by excitement around Artificial Intelligence (or AI) as the release of the ChatGPT bot has taken this technology into the mainstream. Whilst this is undoubtedly set to have a major longer term impact on how we do things, and has the potential to boost productivity and corporate profits, it feels somewhat similar to the dotcom boom of the late 90s. Indeed, scratching beneath the surface shows that almost the whole of the rise in US equity markets has been driven by just seven stocks, these being Alphabet (Google), Amazon, Apple, Meta (Facebook), Microsoft, Nvidia and Tesla.
As we enter the second half of the year, the question will be does the rally in the aforementioned stocks broaden out to the rest of the market or is this just AI excitement. The answer is likely to be driven by central banks’ willingness to keep rates elevated. It also feels that savings levels have so far insulated the wider economy from the effects of rising rates and as we go through the rest of the year the long expected slowdown will begin to show up. Whilst we do not expect this to be deep and painful, there is currently perhaps too much optimism in equity markets, whilst bond markets are painting a very different picture, with history telling us they are rarely wrong.
APM PORTFOLIOS - QUARTER TWO 2023 PERFORMANCE
The graphs below show how the APM portfolios within the four Finance Shop risk categories have behaved over the last three months. The first graph shows the total return for the quarter whereas the second graph illustrates the “month by month” performance. The performance figures are aggregated so, for example, the green bar is made up of all the APM Multi-Asset Balanced portfolios across all product types.
If you require specific performance figures for your plan, please contact your adviser.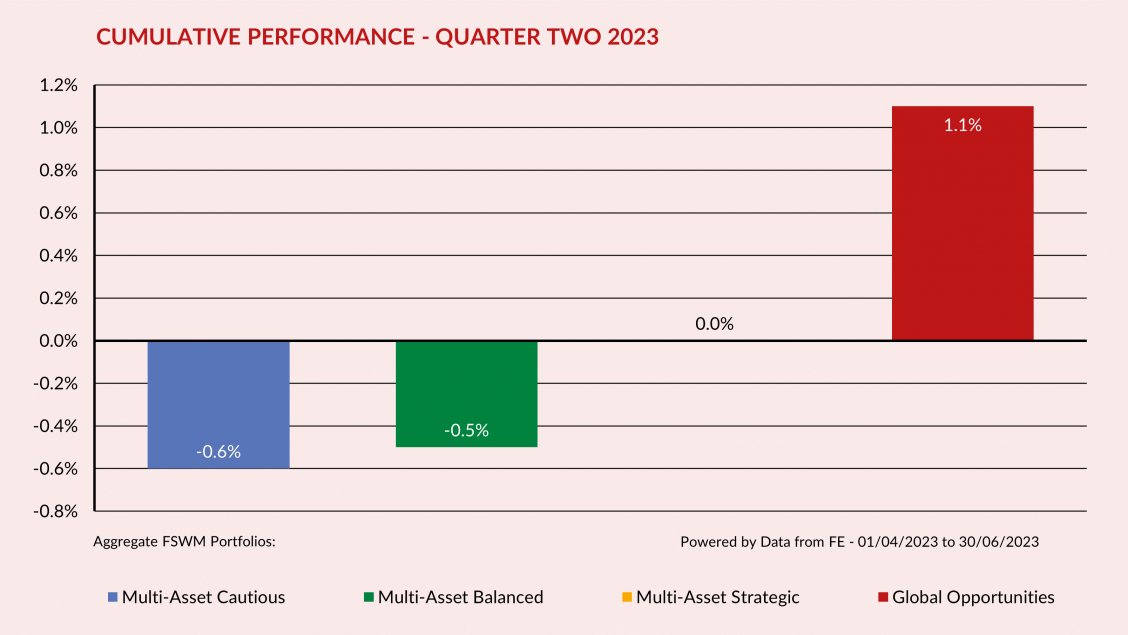
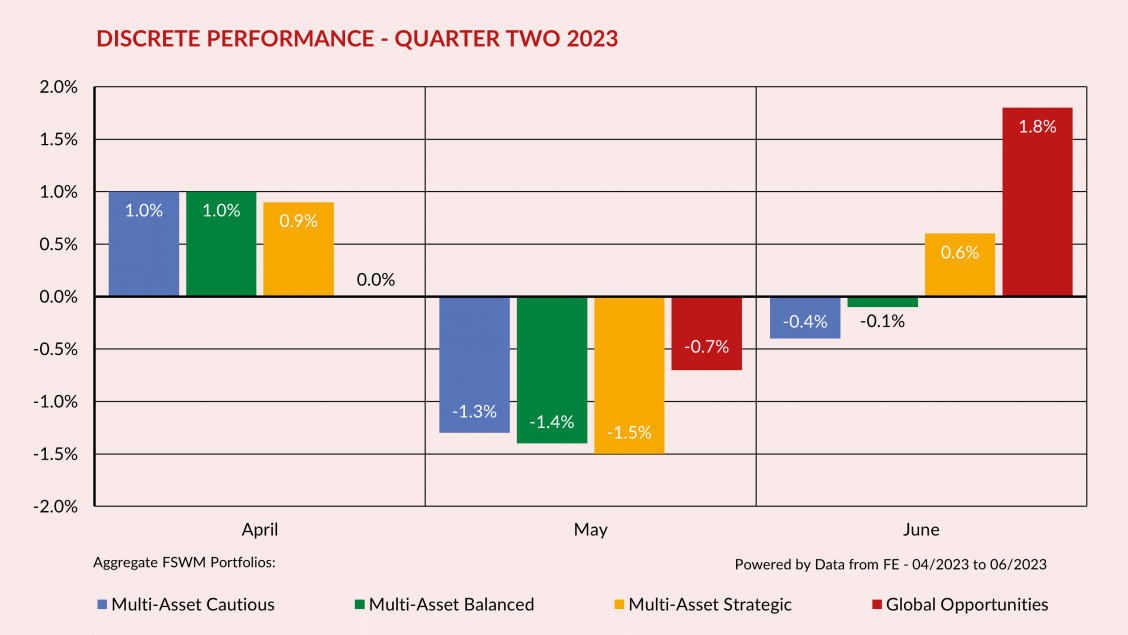
PERFORMANCE REVIEW
Portfolios delivered mixed returns this quarter, perhaps unsurprisingly it was the more adventurous mandates that fared best, with the greater equity content boosting returns. We continue to believe that conditions warrant a broad balance of assets, with a focus on quality.
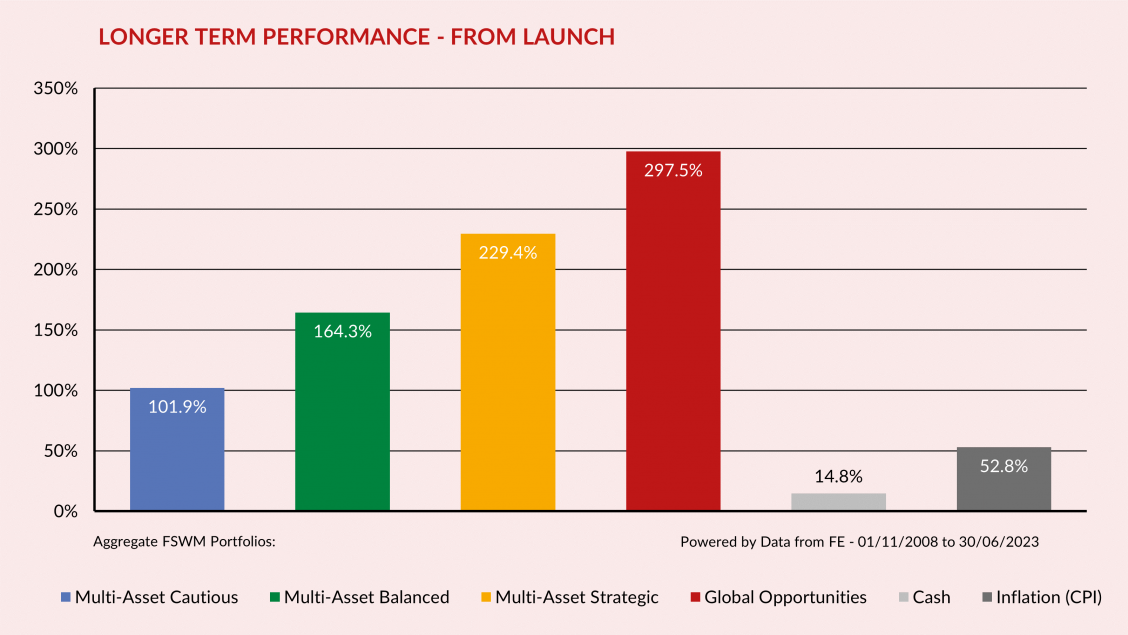
APM PORTFOLIOS - LONGER TERM PERFORMANCE
The first graph below shows how the APM portfolios have performed over 12 months. For comparison, the returns of cash (MoneyFacts 90 days’ notice 10K) and inflation (UK Consumer Price Index) are also shown. The second graph illustrates how the portfolios have performed since launch (1st November 2008).
As with the Cumulative & Discrete Performance graphs, the figures for each category are aggregated.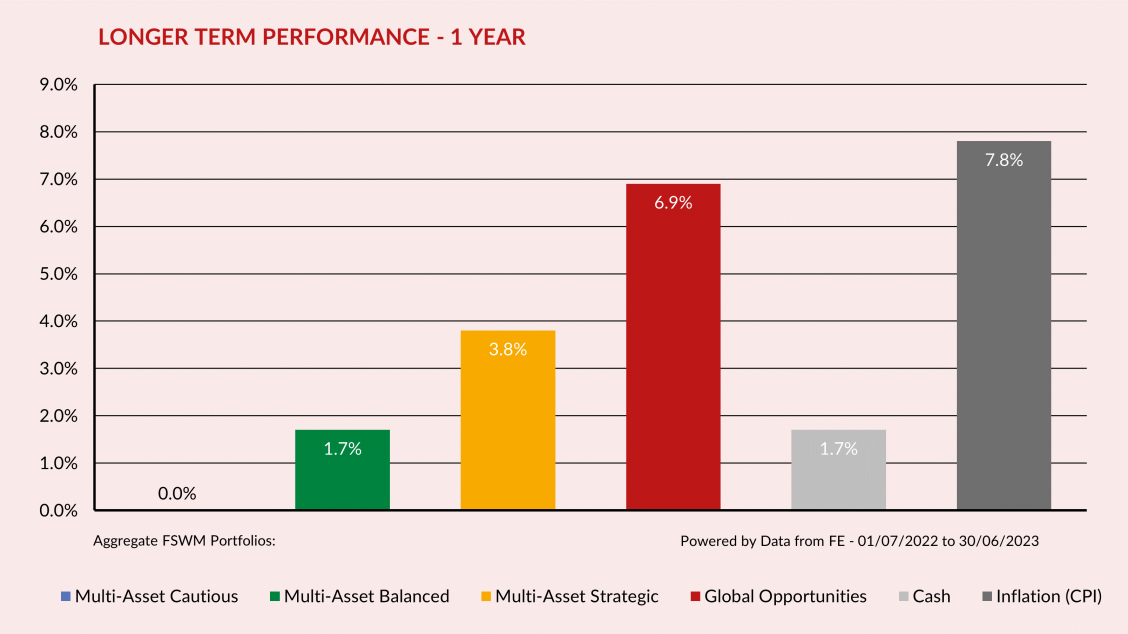
APM FUND REVIEW POLICY
A key part of the APM service is to monitor the underlying performance of each fund within the portfolios for both risk and return. We have selected quality funds with strong track records and therefore do not envisage a high turnover of holdings.
However, there will be occasions when the performance of an individual fund will lead to its expulsion from the portfolio(s). There are several factors that determine this decision, for example consistent under-performance, change of management team etc. It is also important, however, to have patience with a fund that is just suffering short-term under-performance.
We operate a “traffic light” system and will move a fund from a “green” to “amber” rating if the fund requires closer scrutiny at the next review. If a fund shows sufficient improvement, it will move back to “green”.
If the fund consistently under-performs without good reason its status will change to “red” and the fund will be removed from the portfolio(s). A replacement fund will be selected and all clients holding the fund within their portfolio will be notified. Upon receipt of their authority, the client’s funds will be switched accordingly.
RESULTS OF FUND & ASSET ALLOCATION REVIEW
The Investment Committee meets on a quarterly basis and one of its primary functions is to review our existing fund range.
Within this meeting we scrutinise any funds which we feel are performing significantly differently to their peer group or benchmark, with a number then run against our internal performance and risk measurements.
The funds under review are as follows:
• Brooks Macdonald Defensive Capital
• CT American Select
• Crux UK Core
• Downing Unique Opportunities
• Fidelity Strategic Bond
• GAM Star Credit
• Gravis UK Listed Property
• Gravis Digital Infrastructure
• Jupiter Monthly Alternative Income
• Matthews Asia ex Japan Total Return
• Pictet Security
• Polar Capital Global Convertibles
IMPORTANT INFORMATION
This report has been issued by the Investment Committee of the Finance Shop Wealth Management team using data provided by Financial Express. Care has been taken to ensure that the information is correct but Financial Express and Finance Shop neither warrants, represents nor guarantees the contents of the information, nor does Financial Express or Finance Shop accept any responsibility for errors, inaccuracies, omissions, or any inconsistencies herein.
Past performance is not a guide to future performance. The value of investments and the income from them may go down as well as up and investors may not get back the amount originally invested. Currency fluctuations can also affect fund values. The above report does not constitute advice and you should speak to your Independent Financial Adviser before you make any alterations to investments or pension plans.
The instruments recorded above are weighted model portfolios created using Financial Express Analytics. Performance figures shown are based on the weighted models and may differ from the actual returns achieved by investors. Performance figures shown are based on bid-to-bid gross returns and do not include plan, contract, or ongoing adviser charges / commission. Please refer to your policy documentation for further details.