
Welcome to the autumn 2018 Finance Shop Wealth Management (FSWM) Quarterly Review.
The Finance Shop Quarterly Review provides clients in our Advisory Portfolio Management (APM) service a review of the financial world over the last three months, and how this may have affected their pension or investment. If you would like to read more about this service, please Click Here.
A key part of the reporting is the colour coding. Each FSWM portfolio is colour coded to enable you to spot which category applies to you. The relevant information is then presented in a clear and easy to understand way. However, if you require any further clarification, please do not hesitate to get in touch.
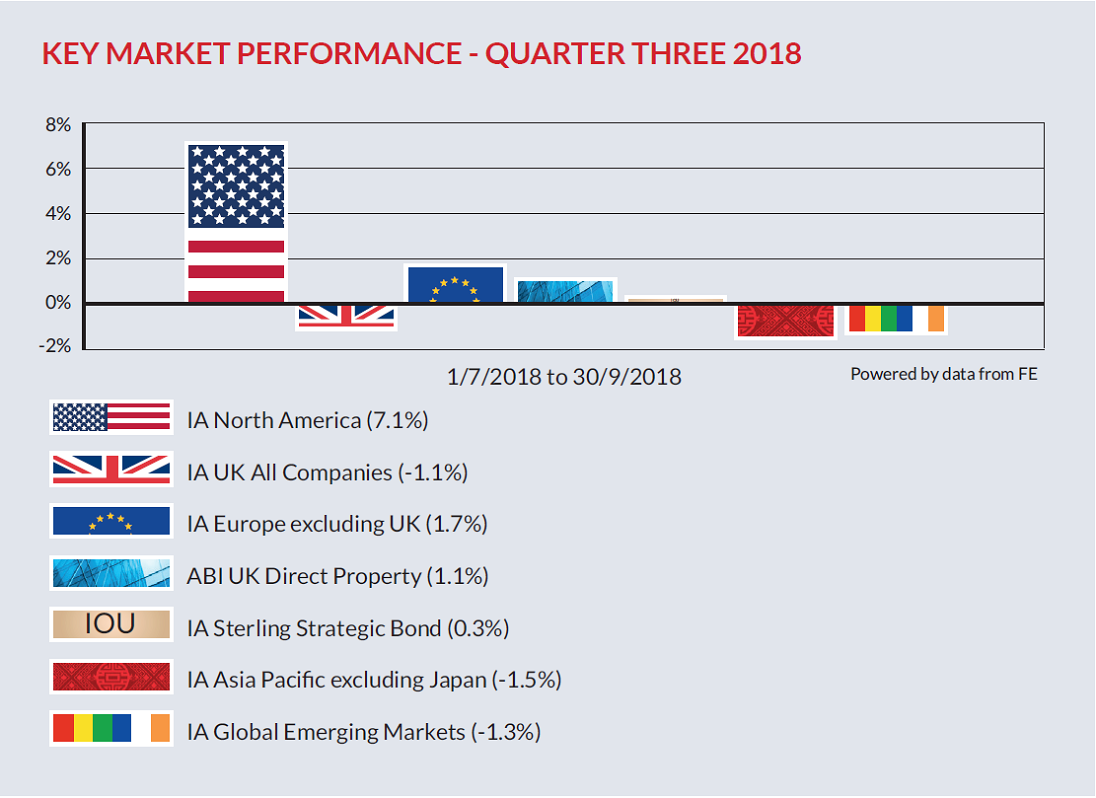
MARKET OVERVIEW – QUARTER THREE 2018
Quarter three once again saw a diversified spread of returns with the US the standout performer driven higher by strong corporate earnings numbers. Elsewhere trade war concerns impacted Asia, whilst emerging markets continued to be buffeted by the stronger dollar. Towards the end of the quarter the Federal Reserve voted to increase interest rates in the US by a further quarter percentage point to 2.25%, with another hike likely in December.
As we enter the fourth quarter focus will switch to the mid-term elections in the US where, should Donald Trump fare badly and the Democrats pick up substantial gains, it will at best impact his ability to push through further business friendly policies or at worst see an attempt to impeach him.
No wonder therefore that OPEC’s decision to only marginally increase production at their recent meeting angered Donald Trump, particularly as US sanctions on Iran are beginning to squeeze supply, pushing up prices further and because voters in the US are often influenced by the price it costs to fill up their cars.
In the UK, Brexit continues to dominate the headlines, the majority of which are negative, and whilst it is impossible to determine the outcome we remain of the opinion that the worst case scenario will be avoided.
FSWM PORTFOLIOS - QUARTER THREE 2018 PERFORMANCE
The graphs below show how the FSWM portfolios within the four Finance Shop risk categories have behaved over the last three months. The first graph shows the total return for the quarter whereas the second graph illustrates the “month by month” performance. The performance figures are aggregated so, for example, the green bar is made up of all the FSWM Multi-Asset Balanced portfolios across all product types. If you require specific performance figures for your plan, please contact your adviser.
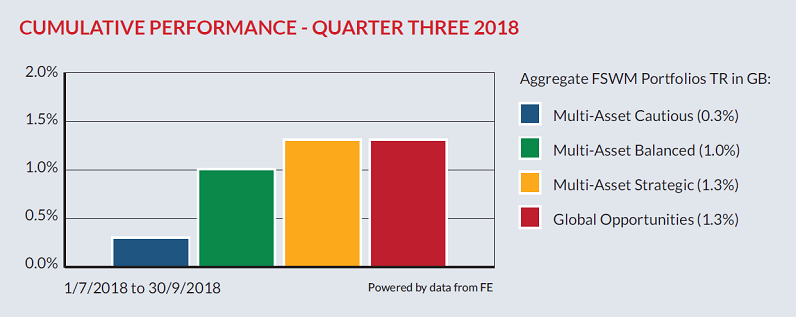
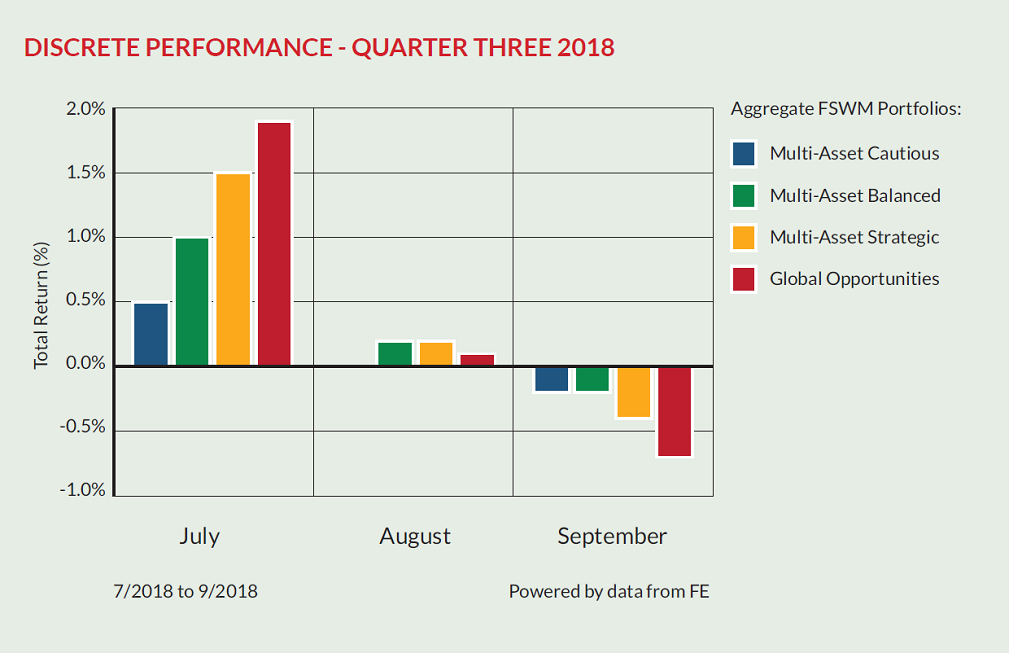
PERFORMANCE REVIEW
Despite a more challenging backdrop, all of the portfolios pleasingly delivered another positive quarter. Whilst we remain mindful of increasing headwinds, we continue to believe that equities offer reasonable value and can deliver positive returns.
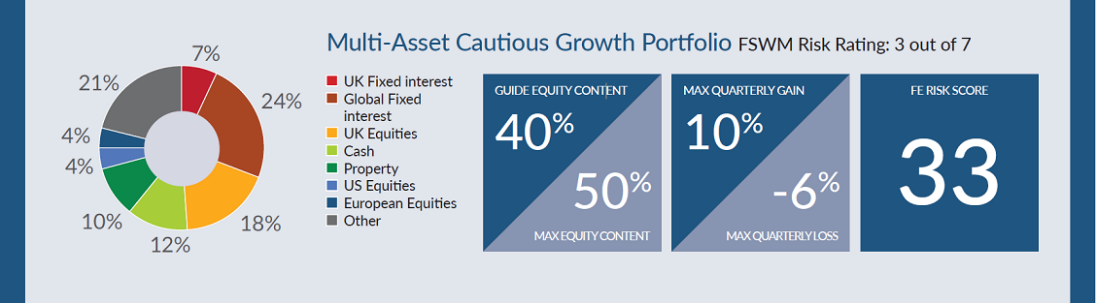
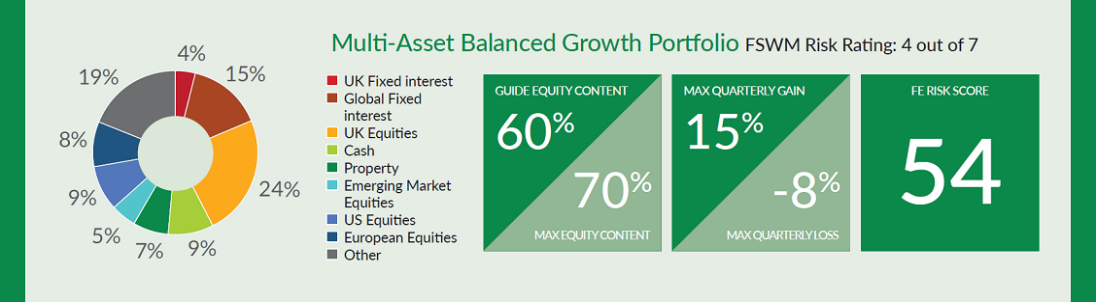
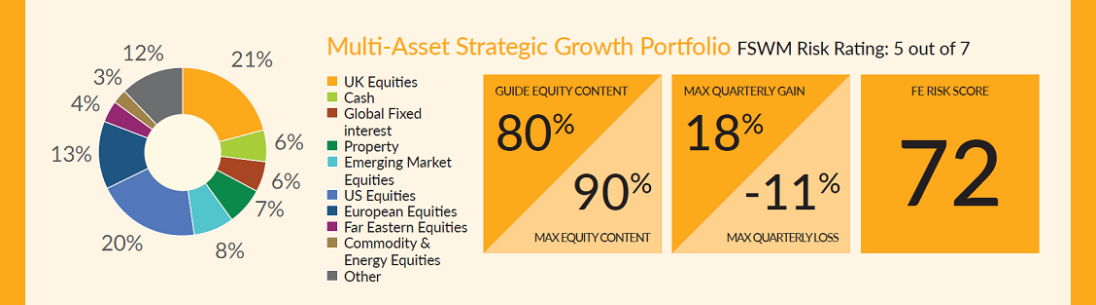
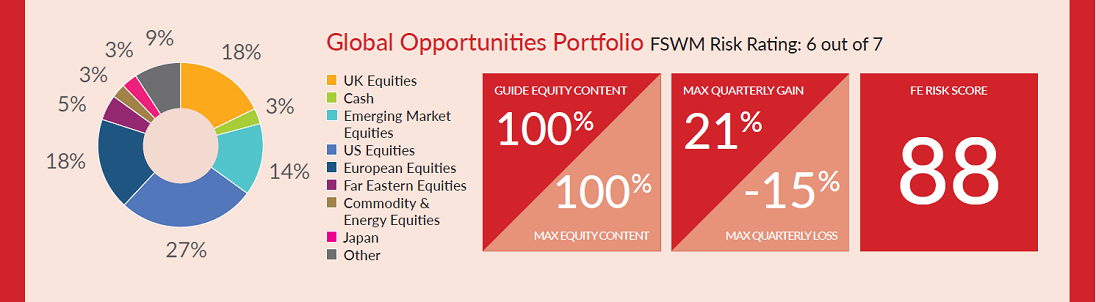
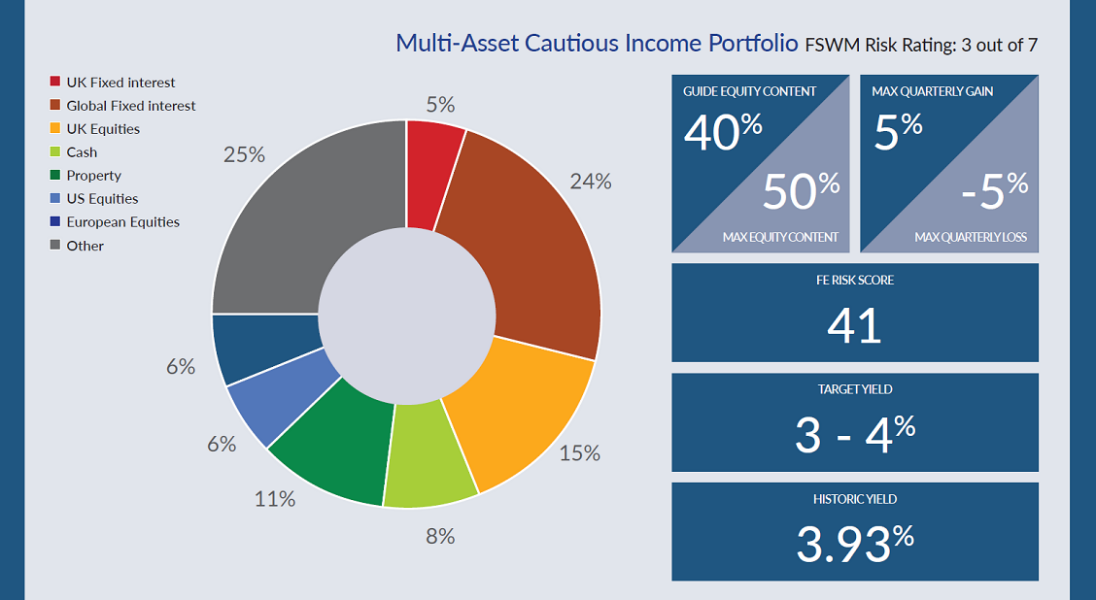
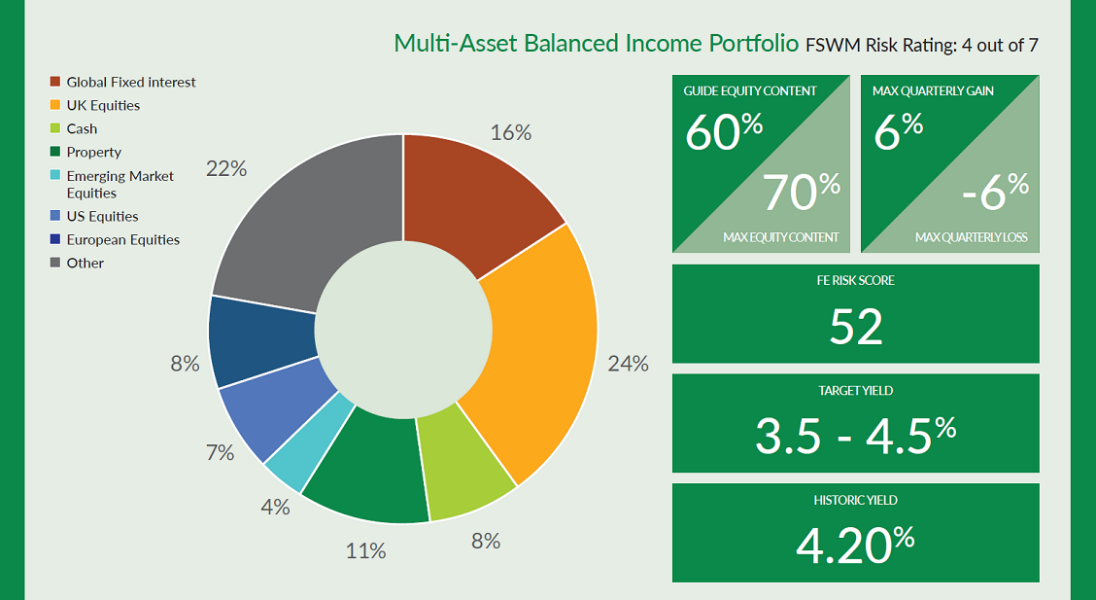
FSWM PORTFOLIOS – ASSET ALLOCATION
There are six portfolios in the FSWM range, four growth and two income which are detailed below. Your FSWM pension or investment will be invested in one of these categories. The tables show the aggregate composition of the portfolios with some figures to show the potential risk and return of each category.
GROWTH PORTFOLIOS
INCOME PORTFOLIOS
There are two income portfolios which aim to produce an income within a target range as highlighted in the table below. The two portfolios cover the Cautious and Balanced Finance Shop risk categories.
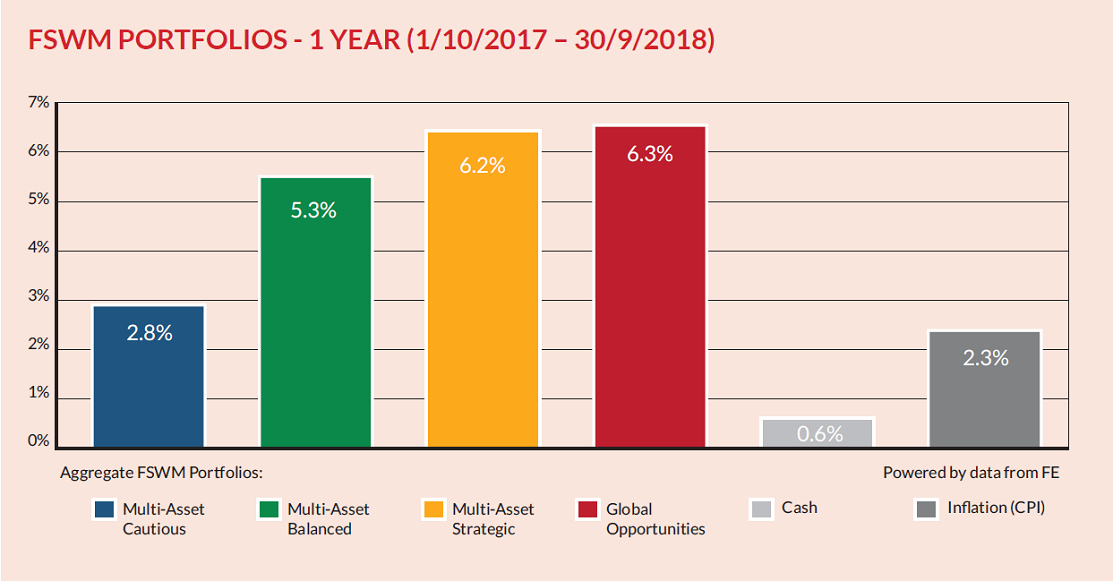
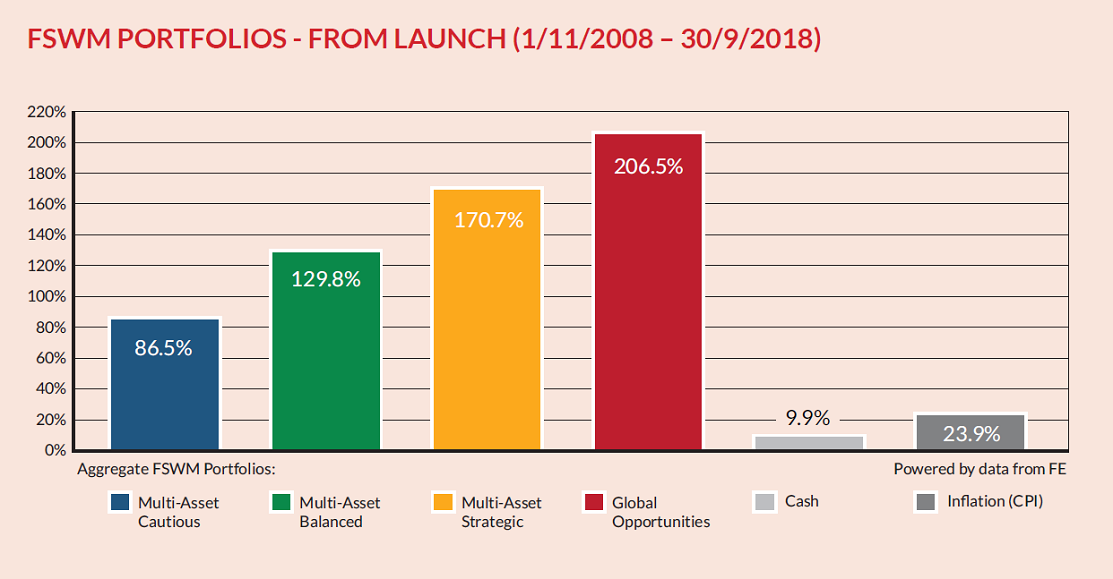
FSWM PORTFOLIOS – LONGER TERM PERFORMANCE
The first graph below shows how the FSWM portfolios have performed over 12 months. For comparison, the returns of cash (MoneyFacts 90 days notice 10K) and inflation (UK Consumer Price Index) are also shown. As with the graphs on page 6, the figures for each category are aggregated.
The second graph illustrates how the portfolios have performed since launch (1st November 2008).
FSWM FUND REVIEW POLICY
A key part of the FSWM service is to monitor the underlying performance of each fund within the portfolios for both risk and return. We have selected quality funds with strong track records and therefore do not envisage a high turnover of holdings. However, there will be occasions when the performance of an individual fund will lead to its expulsion from the portfolio(s). There are a number of factors that determine this decision, for example consistent under-performance, change of management team etc. It is also important, however, to have patience with a fund that is just suffering short-term under-performance.
We operate a “traffic light” system and will move a fund from a “green” to “amber” rating if the fund requires closer scrutiny at the next review. If a fund shows sufficient improvement, it will move back to “green”. If the fund consistently under-performs without good reason its status will change to “red” and the fund will be removed from the portfolio(s). A replacement fund will be selected and all clients holding the fund within their portfolio will be notified. Upon receipt of their authority, the client’s funds will be switched accordingly.
RESULTS OF FUND & ASSET ALLOCATION
The Investment Committee meets on a bi-monthly basis and one of its primary functions is to review our existing fund range.
Within this meeting we scrutinise any funds which we feel are performing significantly differently to their peer group or benchmark, with a number then run against our internal performance and risk measurements.
There were several changes to the funds under review, with Invesco Perpetual Global Income, Janus Henderson UK Absolute, Ardevora UK Equity and Goldman Sachs Emerging Markets being added and Fidelity Moneybuilder Dividend, Invesco Perpetual Income and M&G Global Macro being removed, leaving the following funds under review:
• Ardevora UK Equity
• Aviva Multi-Strategy Growth
• City Financial Absolute
• Blackrock Continental European Income
• Fidelity Enhanced Income
• Garraway Financial Trends
• Goldman Sachs Emerging Markets
• Invesco Perpetual Global Income
• Janus Henderson UK Absolute
• JP Morgan Multi-Asset Income
ASSET ALLOCATION TABLE PAGES FOUR AND FIVE – IMPORTANT INFORMATION
The maximum quarterly gain and loss figures in the asset allocation tables on pages 4 & 5 are taken from Financial Express based on the last 38 quarters of the longest running FSWM portfolios (up to August 2018). For the table on page 5, the figures are based on 20 quarters.
FE Risk Score: Financial Express have introduced FE Risk Scores to provide a single, easy to understand measure of risk across a range of investments. In the UK, Risk Scores measure the riskiness of any given investment in relation to the FTSE 100. Weekly volatility is measured over up to 3 years, with recent behaviour counting more heavily than earlier behaviour. The Risk Score is calculated weekly, and can be tracked over time. Cash type investments will have scores near zero, investment funds will tend to have scores in the 0 - 150 range.
The FTSE 100 is always 100. There is no upper limit to the scores.
The asset allocation figures on pages 4 and 5 are aggregated based on the current holdings within the FSWM portfolios for a new investor as at 1st August 2018 (growth portfolios) and 10th August 2018 (income portfolios). They will vary on a daily basis subject to market fluctuations. Rebalancing will be recommended if equity content exceeds the benchmark maximums. There is no guarantee that any of the model portfolios above will achieve their stated objectives. Each model portfolio may also experience more or less volatility than expected. The value of investments will fall as well as rise and are not guaranteed. Past performance is no guide to future performance. The Finance Shop Risk Categories are graded from 1 to 7. The above portfolios cover categories 3 to 6. For further information on all categories, please speak to your Finance Shop Independent Financial Adviser.