
Welcome to the ADVISORY PORTFOLIO MANAGEMENT (apm) Autumn 2025 Quarterly Review.
The Advisory Portfolio Management (APM) Quarterly Review provides clients within the service a review of the financial world over the last three months, and how this may have affected their pension or investment. If you would like to read more about this service, please Click Here.
A key part of the reporting is the colour coding. Each APM portfolio is colour coded to enable you to spot which category applies to you. The relevant information is then presented in a clear and easy to understand way. However, if you require any further clarification, please do not hesitate to get in touch.
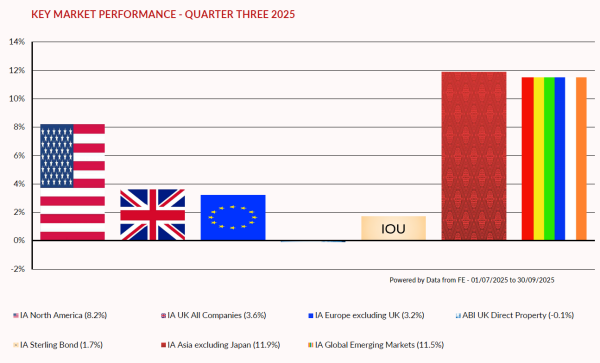
MARKET OVERVIEW – QUARTER THREE 2025
The third quarter has been one of strong returns across nearly all asset classes as the continued unwind of the tariff related concerns boosted sentiment. The willingness to engage in negotiations and subsequent deals on tariffs, pushed markets higher. Further support came from robust quarterly earnings numbers which, on the whole, came in above expectations, with the large technology names at the vanguard. Perhaps more importantly was the fact that forward projections remained intact, with little suggestion that tariff costs were causing a slowdown. Additionally, AI (artificial intelligence) spending appears to remain resilient, pushing many of the largest technology stocks to all-time highs. Indeed Nvidia, now the world’s largest company by market capitalisation, is approaching the size of the whole Japanese market combined, which is the second largest stock market after the US. Finally, interest rates around much of the globe are on a downward trajectory, and weaker jobs data led the US central bank to join the party and cut interest rates, thus improving liquidity and pushing more money into risk assets.
One of the other notable trends over 2025 has been the strong run of the gold price. It appears that the policies of the Trump administration, along with his interference into a number of US institutions, such as the Federal Reserve, along with the rise of geopolitical risk, is causing a rethink, led by emerging market central banks reallocating assets into gold.
The final quarter is likely to be dominated by two themes, firstly does tariff related costs show up in US data. Much scrutiny will be on consumer spending trends, corporate profits and outlooks, and inflation data. This will feed into interest rate policy in the US and may result in increased volatility. Secondly, in the UK, the focus switches to the November Budget, as the under-pressure Chancellor tries to create enough funding to balance the books without upsetting the electorate or the bond market, a difficult tightrope to walk.
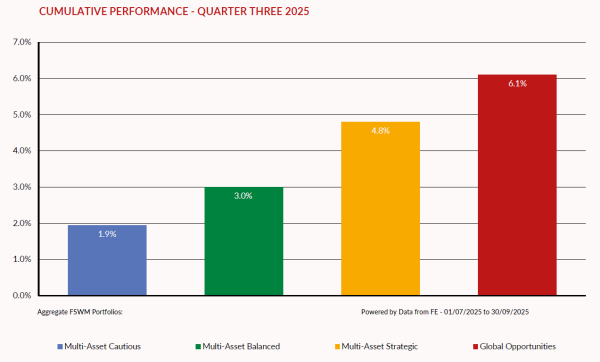
APM PORTFOLIOS – QUARTER THREE 2025 PERFORMANCE
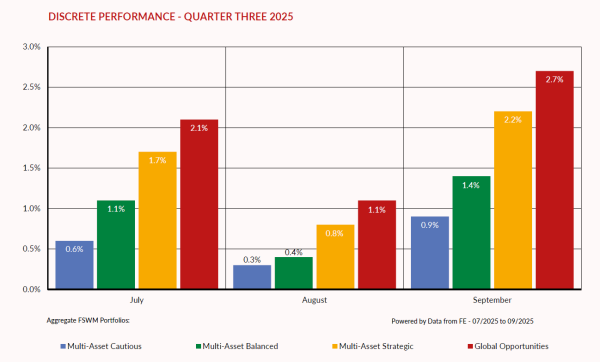
The graphs below show how the APM portfolios within the four Finance Shop risk categories have behaved over the last three months. The first graph shows the total return for the quarter whereas the second graph illustrates the “month by month” performance. The performance figures are aggregated so, for example, the green bar is made up of all the APM Multi-Asset Balanced portfolios across all product types.
If you require specific performance figures for your plan, please contact your adviser.
PERFORMANCE REVIEW
Hardly surprisingly the very adventurous strategy posted the best results, as its greater exposure to equities boosted returns. All the other portfolios also produced solid returns and have delivered pleasing results year-to-date. We expect our diversified approach to asset allocation within the portfolios to continue to benefit returns, which are increasingly being driven by a more multifaceted selection of factors.
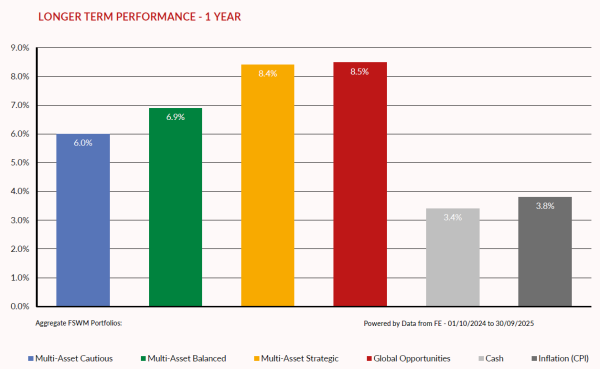
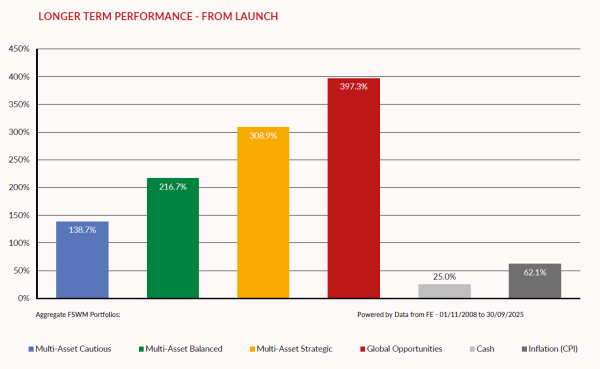
APM PORTFOLIOS – LONGER TERM PERFORMANCE
The first graph below shows how the APM portfolios have performed over 12 months. For comparison, the returns of cash (MoneyFacts 90 days’ notice 10K) and inflation (UK Consumer Price Index) are also shown. The second graph illustrates how the portfolios have performed since launch (1st November 2008).
As with the graphs on the previous page, the figures for each category are aggregated.
APM FUND REVIEW POLICY
A key part of the APM service is to monitor the underlying performance of each fund within the portfolios for both risk and return. We have selected quality funds with strong track records and therefore do not envisage a high turnover of holdings.
However, there will be occasions when the performance of an individual fund will lead to its expulsion from the portfolio(s). There are several factors that determine this decision, for example consistent under-performance, change of management team etc. It is also important, however, to have patience with a fund that is just suffering short-term under-performance.
We operate a “traffic light” system and will move a fund from a “green” to “amber” rating if the fund requires closer scrutiny at the next review. If a fund shows sufficient improvement, it will move back to “green”.
If the fund consistently under-performs without good reason its status will change to “red” and the fund will be removed from the portfolio(s). A replacement fund will be selected and all clients holding the fund within their portfolio will be notified. Upon receipt of their authority, the client’s funds will be switched accordingly.
RESULTS OF FUND & ASSET ALLOCATION REVIEW
The Investment Committee meets on a quarterly basis and one of its primary functions is to review our existing fund range.
Within this meeting we scrutinise any funds which we feel are performing significantly differently to their peer group or benchmark, with a number then run against our internal performance and risk measurements.
The funds under review are as follows:
· Atlantic House Balanced Return Fund
· Blackrock European Dynamic
· Downing Unique Opportunities
· Fidelity Strategic Bond
· Gravis UK Infrastructure Income Fund
· Heriot Global
· Jupiter European Fund
· Jupiter Strategic Bond
· Liontrust Special Situations Fund
· Matthews Asia Discovery Fund
· Polar Cap Global Insurance
· Premier Miton UK Value Opportunities
· Regnan Global Impact Solutions Fund
· VT De Lisle America
IMPORTANT INFORMATION
This report has been issued by the Investment Committee of the Finance Shop Wealth Management team using data provided by Financial Express. Care has been taken to ensure that the information is correct but Financial Express and Finance Shop neither warrants, represents nor guarantees the contents of the information, nor does Financial Express or Finance Shop accept any responsibility for errors, inaccuracies, omissions, or any inconsistencies herein.
Past performance is not a guide to future performance. The value of investments and the income from them may go down as well as up and investors may not get back the amount originally invested. Currency fluctuations can also affect fund values. The above report does not constitute advice and you should speak to your Independent Financial Adviser before you make any alterations to investments or pension plans.
The instruments recorded above are weighted model portfolios created using Financial Express Analytics. Performance figures shown are based on the weighted models and may differ from the actual returns achieved by investors. Performance figures shown are based on bid-to-bid gross returns and do not include plan, contract, or ongoing adviser charges / commission. Please refer to your policy documentation for further details.